We Killed Datadog DBM. Here's What Broke.
General-purpose monitoring tools show you charts. They don't find regressions. We turned off Datadog DBM and caught more real Postgres issues in the first week with a plan-aware tool.
Venkat Sakamuri
DeepSQL R&D · Ex Oracle Query Engine Team · YC & CMU

TL;DR
- General-purpose observability tools like Datadog DBM are great at telling you that you have a problem (CPU is high!), but terrible at telling you why.
- The most dangerous database regressions aren't catastrophic failures; they're subtle query plan flips that cause a slow, creeping degradation your dashboards will miss.
- We turned off Datadog DBM, saving over $50k/year, and immediately started catching regressions that had been invisible to us for months.
I spent years on the Oracle query optimizer team. We lived and breathed execution plans. We'd argue for days about costing models for hash joins versus nested loops. When you live that deep in the engine, you develop a certain intolerance for tools that treat the database like a dumb black box.
This is my core issue with most "Database Monitoring" products tacked onto general-purpose observability platforms. They look great in a sales demo. They produce beautiful charts. But when you’re in a P1 incident at 2 AM, you realize you've paid a premium for a pretty frontend on pg_stat_statements.
We were running Datadog DBM across our fleet of Postgres instances—a primary and a dozen read replicas. The bill was eye-watering, north of $50,000 a year, and for what? We got CPU and memory utilization, a list of normalized slow queries, and some high-level wait event analysis. It told us our p99 latency was up. Thanks. I could have gotten that from my load balancer logs.
The workflow was always the same. An alarm fires: "High CPU on pg-replica-7". We'd log into Datadog, see a spike, and see the top normalized queries. Okay, UPDATE users SET last_seen = %s WHERE id = %s is taking longer. Now what? Is it lock contention? A bad plan? IOPS saturation? Index bloat? Datadog has no idea. It just shows you the symptom. The DBA or on-call engineer still has to start from scratch, connect to the box, and run their own diagnostics. The tool just started the clock on a fire drill.
The Regression That Cements Your Opinion
The final straw wasn't a big outage. It was the quiet ones. The performance regressions that kill you slowly.
We had a query hitting a reports table. It was a simple lookup, executed thousands of times per minute. The original, fast plan used an Index Only Scan on a covering index.
-- The "Good" Plan
Index Only Scan using reports_account_id_created_at_idx on reports
  Index Cond: (account_id = 123) AND (created_at > '2023-10-26')
  Heap Fetches: 0
  Planning Time: 0.15ms
  Execution Time: 0.85ms
A developer, working on a new feature, added a new, slightly different index to the same table. In isolation, the change was harmless. But it had a side effect: it slightly changed the planner's estimated cost for a different access path. After the next ANALYZE ran on the table, the Postgres planner decided that for some account_id values, a different plan was now cheaper.
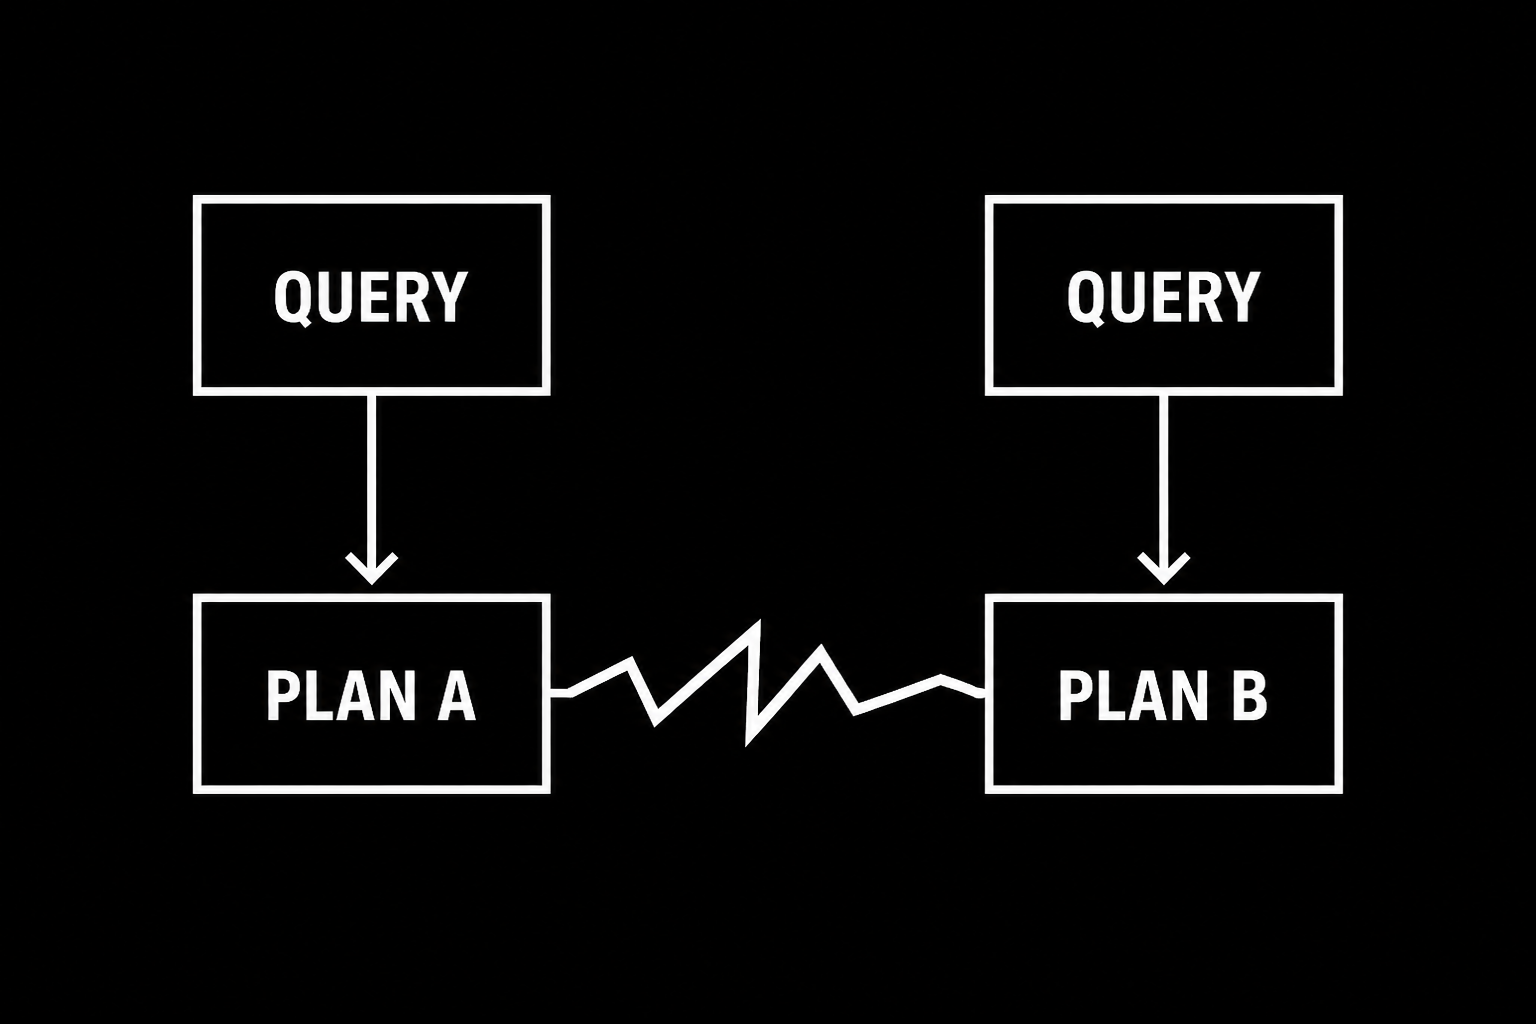
The query plan for our high-frequency lookup flipped.
-- The "Bad" Plan that looks benign
Bitmap Heap Scan on reports
  Recheck Cond: (account_id = 123) AND (created_at > '2023-10-26')
  Heap Blocks: exact=15
  ->  Bitmap Index Scan on reports_new_feature_idx
        Index Cond: (account_id = 123)
  Planning Time: 0.25ms
  Execution Time: 4.5ms
Notice a few things. No more Index Only Scan. We're now doing a Bitmap Index Scan and then a Bitmap Heap Scan. We're hitting the table's heap, indicated by Heap Fetches (which would be non-zero in a full ANALYZE (BUFFERS) output) and Heap Blocks. Execution time went from under 1ms to 4.5ms.
A 4x slowdown on a single query execution is tiny. But at 2,000 queries per minute, that’s an extra (4.5 - 0.85) * 2000 * 60 = 438,000 milliseconds, or 7.3 minutes of extra database time per hour. That's real CPU being burned. That's buffer pool pollution. That's a slow, creeping increase in your p99 latency across the entire application.
Datadog DBM was completely blind to this. The normalized query was the same. The query hash was the same. There was no new, slow query to report. The aggregate CPU chart might have ticked up by a few percentage points, but it was lost in the noise of daily traffic patterns. It never triggered an alert. It just became the new, worse normal.
The First Week After Pulling the Plug
We ripped out the Datadog agent. The cost savings alone made it worth it. But the real value was in replacing it with a tool built for the job.
Within the first week, DeepSQL flagged two critical, non-obvious regressions.
The first was exactly the reports table plan flip I described above. It had been happening for months. DeepSQL alerted us with: "Plan Flip Detected for Query Hash ab12cd34. Switched from plan c987a654 to f543b210, resulting in a 400% increase in average execution time and a 500% increase in buffer reads. The previous plan used an Index Only Scan." It didn't just show us a chart; it showed us the diff of the EXPLAIN plans and pointed to the root cause. The fix was a one-line DROP INDEX for the offending new index (which turned out to be redundant anyway).
The second was more subtle. An UPDATE-heavy table had its autovacuum_scale_factor lowered aggressively by a well-meaning engineer trying to reduce bloat. This caused autovacuum to run far more frequently. DeepSQL detected a pattern of increased lock waits on that table, correlating the RowExclusiveLock waits from application queries directly with the AccessExclusiveLock often taken by VACUUM processes. The alert wasn't "queries are slow," it was "application queries on table fact_events are spending 35% of their execution time waiting on locks held by autovacuum workers." We were strangling our own throughput.
This is the difference between database observability and database analysis. Observability shows you the what. Analysis tells you the why. You can't get to "why" by looking at CPU charts. You get there by understanding query plans, lock graphs, memory allocation, and the behavior of the database's internal maintenance processes.
General-purpose tools are a mile wide and an inch deep. They have to be. They need to monitor Redis, then your Python app, then your Kubernetes cluster, then Postgres. It's a miracle they work at all. But for a stateful, complex system like a relational database, an inch deep isn't good enough. You're paying a premium for superficiality.
What DeepSQL does about this
DeepSQL is purpose-built for relational query engines, not as a generic metrics collector. It doesn't stop at showing you a normalized query and its average latency. It continuously fingerprints and analyzes the execution plan for every significant query, automatically alerting on plan flips that degrade performance. It correlates these changes with schema diffs, statistics updates, and configuration changes to pinpoint the commit or event that caused the regression. Instead of a chart, you get a root cause analysis that connects a latency spike to the exact Bitmap Heap Scan that replaced a previous Index Only Scan.